
Based on national wildfire and fuels data, PyroRisk is happy to introduce PRZ2025 as a free set of data to visualize wildfire risk. Available in GIS shapefile format (contact [email protected])
Please read how to use below:
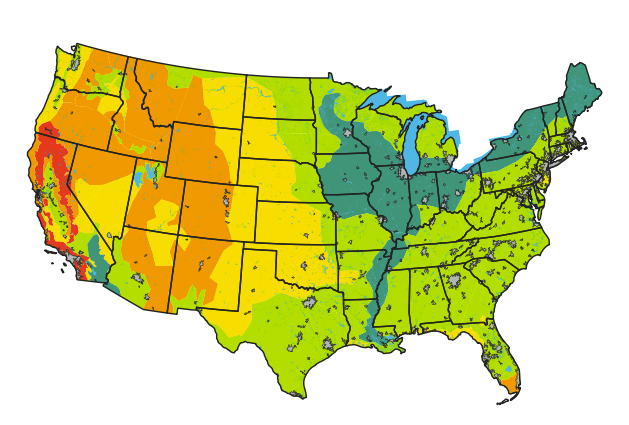
This lower resolution version of the data (free version) is meant for utilities to be able to quantitatively compare their service territory risk versus other areas.
This is not a “full risk” view. It does not take into account the proximity of structures, nor the condition of utility equipment. But it does give a good idea of the fuel risks.
There are 5 levels ranging from red, orange, yellow, green, and aqua. Gray areas are urban areas.
Notes:
There are disconnected yellow and orange regions in Louisiana, Mississippi, Alabama, Florida, Georgia, and New Jersey that might be too small to notice.
More PyroBlog posts will address how utilities can use the PRZ to formulate their Wildfire Mitigation Plans (WMP) and assess risk.